

PE Surge and Fatigue
Introduction
Polyethylene pressure pipes are designed on the basis of a burst regression line for pipes subjected to constant internal pressure. From this long-term testing and analysis, nominal working pressure classes are allocated to pipes as a first indication of the duty for which they are suitable. However, there are many other factors which must be considered, including the effects of dynamic loading. Whilst most gravity pressure lines operate substantially under constant pressure, pumped lines frequently do not and it is essential that the effects of this type of loading be considered in the pipeline design phase to avoid premature failure.
Pressure fluctuations in pumped mains result from events such as pump start-up and shutdown or valves opening and closing. The approach adopted for pipe design and class selection when considering these events depends on the anticipated frequency of the pressure fluctuation as follows:
- for random, isolated surge events, for example, those which result from emergency shutdowns, the designer must ensure that the maximum and minimum pressures experienced by the system are within acceptable limits; and
- for frequent, repetitive pressure variations, the designer must consider the potential for fatigue and design accordingly.
Definitions
For the purposes of this note, surge is defined as a rapid, very short-term pressure variation caused by an accidental, unplanned event such as an emergency shutdown resulting from a power failure. Surge events are characterised by high pressure rise rates with no time spent at the peak pressure. The maximum duration of a surge event is about 5 minutes.
Fatigue is associated with a large number of repetitive events. The key factors to consider are the size and frequency of the repeated event. For large pressure cycles, a lower number of events can be tolerated in the pipe lifetime. For smaller pressure changes, a greater number of events is acceptable.
The gradual diurnal pressure changes which occur in most distribution pipelines as a result of demand variation will not cause fatigue. The only design consideration required for this type of pressure fluctuation is that the maximum pressure should not exceed the pressure rating of the pipe.
Surge design
It has long been recognised that polyethylene pipes are capable of handling short-term stresses far greater than the long-term loads upon which they are designed. However, this characteristic feature has, to date, not been utilised in design in Australia. Previous design recommendations have advised that the peak pressure should not exceed the nominal working pressure of the pipe.
Recently, studies in the UK (1) have examined the response of plastics pipes to short-term over-pressurisation. This work has culminated in the publication of a design recommendation (2) allowing significant over-pressurisation of plastics pipes during rapid surge events. However, while these results highlight the capabilities of plastics pipes in this respect, they do not discuss the effect of over-pressurisation on the pipe where it is restrained by tapping bands or flange connections. The effect on other pipeline components is also not considered.
Field tests of installed pipelines are conducted to verify the pipeline design and construction. These tests are generally carried out at a pressure of 1.25 times the maximum system operating pressure. Since the test pressure is generally the highest pressure a pipeline will experience, the field test serves to demonstrate that all system components, including items such as anchor blocks which are formed in-situ, will be satisfactory for the operating conditions.
The demonstrated ability of polyethylene pipes to accommodate short-term surge pressures can be utilised to advantage by allowing some over-pressurisation. However, it is recommended that the peak design pressure is limited to the field test pressure of that pipeline in order to ensure that the pipeline as a whole is capable of performing under these conditions.
Where the generation of negative pressures is anticipated, the possibility of transverse buckling should be considered.
Fatigue design
Pipes
The fatigue response of thermoplastics pipe materials has been extensively investigated (3-9). The results of laboratory studies can be used to establish a relationship between stress range, defined here as the difference between the maximum and minimum stress (see Fig 2), and the number of cycles to failure. From these relationships it is possible to derive load factors that can be applied to the operating pressures, to enable selection of an appropriate class of pipe.
This type of experimental data inevitably has a degree of scatter and it has been Australian practice, after Joseph (3), to adopt the lower bound for design purposes. This approach is retained here because it ensures the design has a positive safety factor and recognises that pipelines may sustain minor surface damage during installation, which could promote fatigue crack initiation. Note that for fatigue loading situations, the maximum pressure reached in the repetitive cycle should not exceed the static pressure rating of the pipe.
Fittings
Fittings for use with Polyethylene pressure pipe are covered by AS/NZS 4129 “Fittings for polyethylene (PE) pipes for pressure applications” and the performance is based primarily on the body and material tests incorporated in this standard. As for pipe, nominal pressure ratings are based on static pressures and the effects of dynamic loading should also be considered. The following recommendations apply to fully moulded fusion jointing fittings. It does not apply to fabricated fittings and manufacturer’s advice should be sought for mechanical fittings.
From the fatigue testing of fusion fittings (4,10,11) a conservative recommendation is to follow Table 1 for total cycles up to 5,000,000 in the life of the system. For a greater number of cycles, butt-welding is recommended where practical. Alternatively, if electrofusion fittings are necessary, it should be recognised that something less than the expected 100 year design life may be achieved. Based on Bowman’s work (10,11), with an 8 bar surge range and 12 cycles per hour, he estimated an expected service life of 65 years. Note that for fatigue loading situations, the maximum pressure reached in the repetitive cycle should not exceed the static pressure rating of the system.
Table 1 gives the recommended fatigue load factors for polyethylene pipes.
Table 1
| Total Cycles | Approx. No. Cycles/day for 100y life |
Fatigue cycle factor,f PE80B / PE100 |
| 36,500 | 1 | 1.00* |
| 100,000 | 3 | 1 |
| 300,000 | 8 | 1 |
| 500,000 | 14 | 0.95 |
| 1,000,000 | 27 | 0.88 |
| 5,000,000 | 137 | 0.74 |
| 10,000,000 | 274 | 0.68 |
*Maximum allowable factor for fatigue loading pressure cycles
Using Table 1, the Maximum Cyclic Pressure Range for a given class of pipe can be calculated from the following formula:
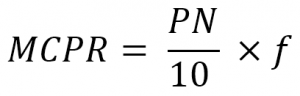
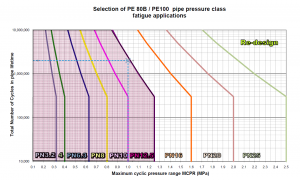
A chart plotting the MCPR versus the number of cycles for a range of pressure classes of PE80B and PE100 pipes is available here.
Procedure
To select the appropriate pipe class for fatigue loading, the following procedure should be adopted:
- Estimate the likely pressure range, i.e., the maximum pressure minus the minimum pressure.
- Estimate the frequency or the number of cycles per day which are expected to occur.
- Determine the required service life and calculate the total number of cycles which will occur in the pipe lifetime
- Using the chart for PE; draw a vertical line from the x-axis at ΔP and a horizontal line from the y-axis at the total number of cycles in the pipe lifetime
- Find the intersection point between the horizontal and vertical lines.
- Select the pipe class that bounds the region of this intersection point as the minimum required for these fatigue conditions.
Example
A sewer rising main has a pump pressure, including static lift and friction losses, of 600 kPa. When the pump starts up, the pressure rises rapidly to 1.1 MPa before decaying exponentially to the static pumping pressure. On pump shut down, the minimum pressure experienced by the system is 100 kPa. On average, the pump will start up 27 times per day. A minimum life of 100 years is required.
The maximum pressure experienced indicates that a minimum class of PN12.5 will be required. A fatigue analysis is now needed in order to determine suitability or otherwise of PN12.5.
In this system, the pressure range, ΔP, is 1MPa. The pump will start up approximately 1,000,000 times in a 100 year lifetime. However, the exponential cycle pattern means that this should be doubled for design purposes. Therefore, the system should be designed to withstand approximately 2,000,000 cycles in a 100 year lifetime.
Using Table 1 to determine the fatigue load factors for polyethylene pipes at 2 × 10 6 cycles gives the following class selections.
| Material | Fatigue Cycle factor, f (Table 1) |
Maximum Cyclic Pressure Range (MCPR) |
Minimum Pipe Class selection |
| PE 80B or 100 | 0.8 | 1.25 x 0.8 = 1.0 = ΔP | PN12.5 |
The fatigue analysis thus determines that PN12.5 is suitable for PE 80B and PE 100.
Definition of Pressure Range
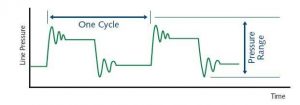
For simplicity, the pressure range is defined as the maximum pressure minus the minimum pressure, including all transients, experienced by the system during normal operations as shown in Figure 2. The effect of accidental conditions such as power failure may be excluded.
Figure 2 also illustrates the definition of a cycle as a repetitive event. In some cases, the cycle pattern will be complex and it may be necessary to also consider the contribution of secondary cycles.
Complex Cycle Patterns
Pumping systems are frequently subject to surging following the primary pressure transient on switching. Such pressure surging decays exponentially, and in effect, the system is subjected to a number of minor pressure cycles of reducing magnitude. In order to take this into account, the effect of each minor cycle is related to the primary cycle in terms of the number of cycles which would produce the same crack growth as one primary cycle.
Using this technique, it is shown in Reference (3) that a typical exponentially decaying surge regime is equivalent to 2 primary cycles. Thus, for design purposes, the primary cycle amplitude only is considered, with the frequency doubled.
In general, similar technique may be applied to any situation where smaller cycles exist in addition to the primary cycle. Empirically crack growth is related to stress range according to (Δσ)3.2. Thus, n secondary cycles of magnitude Δσ1 may be deemed equivalent in effect to one primary cycle, where:
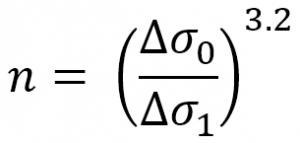
For example, a secondary cycle of half the magnitude of the primary cycle:
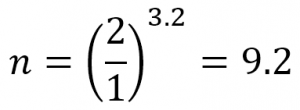
so it would require 9 secondary cycles to produce the same effect as one primary cycle. If they are occurring at the same frequency, the effective frequency of primary cycling is increased by 1.1 for the purpose of design.
Effect of Temperature
Few data have been established concerning the relationships between fatigue performance and temperature. Reference 3 suggests that effects are marginal if any within the range of normal pipeline operating temperatures.
Normal temperature de-rating principles should be applied in class selection for maximum operating pressure. Fatigue should then be considered separately and the highest pressure class selected.
That is, select the highest class arrived via:
a) Static design including temperature derating; or
b) Dynamic design as covered herein.
Safety Factors
Whilst it is always possible to predict the steady operating conditions with good accuracy, it will occasionally be the case, in complex systems, that is impossible to predict the extent of surge pressures. In such circumstances, relatively low cost surge mitigation techniques, for example solid state soft-start motor controllers, should be considered. It is of course recommended that actual operating conditions for all systems should be measured, as a matter of routine, when the system is commissioned. Should surge pressure amplitudes in the event exceed expected levels, it is relatively easy matter to retrofit control equipment to ensure that they are kept in check.
Design Hints
To reduce the effect of dynamic fatigue in an installation, the designer can:
- Limit the number of cycles by:
- Increasing well capacity for a sewer pumping station;
- Matching pump performance to tank size to eliminate short demand cycles for an automatic pressure unit; or
- Using double-acting float valves or limiting starts on the pump by the use of a time clock when filling a reservoir.
- Reduce the dynamic range by:
- Eliminating excessive water hammer; or
- Using a larger bore pipe to reduce friction losses.
References
- MARSHALL, G.P., BROGDEN, S., Final Report of Pipeline Innovation Contract to UKWIR 1997.
- WATER UK INDUSTRY, Water Industry Specification, WIS 4-37-02, March 2000, Issue 1.
- JOSEPH, S.H., (University of Sheffield) “Fatigue Failure and Service Lifetime in uPVC Pressure Pipes”, Plastics and Rubber Processing and Applications, Vol 4, No. 4, 1984, pp. 325-330, UK.
- STREBEL J. J., MOET A., “Accelerated Fatigue Fracture Mechanism of Medium Density Polyethylene Pipe Material”, J. Mat. Sci., 26, 1991, pp. 5671-5680.
- JOSEPH, S.H., “The pressure fatigue testing of plastic pipes. In: Plastics Pipes 4, PRI, London, 1979, Paper 28.
- BEECH, S.H., HEADFORD, A., HUNT, S., AND SANDILANDS, G., “The resistance of polyethylene water pipeline systems to surge pressures,” Plastics Pipes IX conference, The Institute of Materials, Edinburgh, Scotland, UK, 1995, pp 52-9.
- BUCKNALL, C. B., DUMPLETON P., “Factors Affecting Fatigue Crack Growth in HDPE”, Plast. & Rubb.: Proc. And Applns., 5, 1985, pp. 343-347.
- BUCKNALL, C. B., DUMPLETON P., “Fatigue Crack Growth in Polyethylene”, Polym. Eng. Sci., 25 1985, pp. 343-347.
- MARSHALL, G. P., BROGDEN, S., AND SHEPHERD, M. A., “Evaluation of the surge and fatigue resistance of PVC and PE pipeline materials for use on the U.K.Water Industry”, Plastics Pipes X Conference, Gothenburg, Sweden, 1998.
- BOWMAN, J. A., “The fatigue behaviour of medium density polyethylene pipe systems”.
- BOWMAN, J. A., “The fatigue performance of polyethylene pipe joints made with electrofusion fittings.” Plastics and Rubber processing and applications Vol. 9, No.3, 1988.