

PVC Pressure Considerations
Static Stresses
The hydrostatic pressure capacity of PVC pipe is related to the following variables:
- The ratio between the outer diameter and the wall thickness (dimension ratio).
- The hydrostatic design stress for the PVC material.
- The operating temperature.
- The duration of the stress applied by the internal hydrostatic pressure.
The pressure rating of PVC pipe can be ascertained by dividing the long-term pressure capacity of the pipe by the desired factor of safety. Although PVC pipe can withstand short-term hydrostatic pressure applications at levels substantially higher than pressure rating or class, the performance of PVC pipe in response to applied internal hydrostatic pressure should be based on the pipe’s long- term strength.
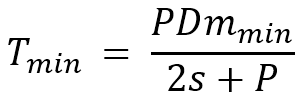
By international convention, the relationship between the internal pressure in the pipe, the diameter and wall thickness and the circumferential hoop stress developed in the wall, is given by the Barlow Formula, which can be expressed in the following forms:
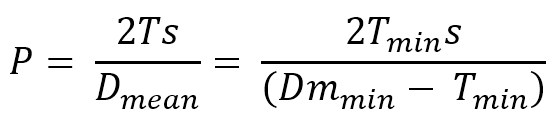
and alternatively, for pipe design,
where:
These formulas have been standardised for use in design, routine testing and research work and are thus applicable at all levels of pressure and stress. They form the basis for establishment of ultimate material limitations for plastic pipes by pressure testing.
For design purposes, P is taken as the maximum allowable working pressure with S being the maximum allowable hoop stress (at 20°C) given below:
| PVC-U pipes up to DN150 | 11.0 MPa |
| DN175 PVC-U pipes and larger | 12.3 MPa |
| Material Class 400 Oriented PVC pipes (PVC-O) | 25 MPa |
| Material Class 450 Oriented PVC pipes (PVC-O) | 28 MPa |
| Material Class 500 Oriented PVC pipes (PVC-O) | 32 MPa |
| Modified PVC pipes (PVC-M) | 17.5 MPa |
Dynamic Stresses
PVC pressure pipes are designed on the basis of a burst regression line for pipes subjected to constant internal pressure. From this long-term testing and analysis, nominal working pressure classes are allocated to pipes as a first indication of the duty for which they are suitable. However, there are many other factors which must be considered, including the effects of dynamic loading. Whilst most gravity pressure lines operate substantially under constant pressure, pumped lines frequently do not. Pressure fluctuations in pumped mains result from events such as pump start-up and shutdown and valves opening and closing. It is essential that the effects of this type of loading be considered in the pipeline design phase to avoid premature failure.
The approach adopted for pipe design and class selection when considering these events depends on the anticipated frequency of the pressure fluctuation. For frequent, repetitive pressure variations, the designer must consider the potential for fatigue and design accordingly. For random, isolated surge events, for example, those which result from emergency shutdowns, the designer must ensure that the maximum and minimum pressures experienced by the system are within acceptable limits.
Definitions
Surge
For the purposes of this document, surge is defined as a rapid, very short-term pressure variation caused by an accidental, unplanned event such as an emergency shutdown resulting from a power failure. Surge events are characterised by high pressure rise rates with no time spent at the peak pressure.
Fatigue
In contrast, fatigue is associated with a large number of repetitive events. Many materials will fail at a lower stress when subjected to cyclic or repetitive loads than when under static loads. This type of failure is known as (cyclic) fatigue. For thermoplastic pipe materials, fatigue is only relevant where a large number of cycles are anticipated. The important factors to consider are the magnitude of the stress fluctuation, the loading frequency and the intended service life. Where large pressure fluctuations are predicted, fatigue design might be required if the total number of cycles over the intended lifetime of the pipeline exceeds 25,000. For smaller pressure cycles, a larger number of cycles can be tolerated.
Pressure Range
Pressure range is defined as the maximum pressure minus the minimum pressure, including all transients, experienced by the system during normal operations
Diurnal pressure changes
Diurnal pressure changes are gradual pressure changes which occur in most distribution pipelines due to demand variation. It is generally accepted that diurnal pressure changes will not cause fatigue. The only design consideration required for this type of pressure fluctuation is that the maximum pressure should not exceed the pressure rating of the pipe.
Surge design
It has long been recognised that PVC pipes are capable of handling short-term stresses far greater than the long-term loads upon which they are designed. That is, PVC pipes can cope with higher pressures than they are designed for provided the higher pressures are of only a short duration. However, this characteristic feature is not utilised in design in Australia and design recommendations advise that the peak pressure should not exceed the nominal working pressure of the pipe. This recommendation is based on the fact the pipes should not be considered in isolation but as part of a system. Whilst the pipes themselves might be capable of withstanding occasional, short duration exposure to pressures greater than the design pressure, the same assumption may not apply to the pipeline system.
Where the generation of negative pressures is anticipated, the possibility of transverse buckling should be considered. This topic is addressed elsewhere.
Fatigue design
The fatigue response of thermoplastics pipe materials, particularly PVC, has been extensively investigated (see references). The results of laboratory studies can be used to establish a relationship between stress range, defined here as the difference between the maximum and minimum stress, and the number of cycles to failure. From these relationships it is possible to derive load factors that can be applied to the operating pressures, to enable selection of an appropriate class of pipe.
This type of experimental data inevitably has a degree of scatter and it has been Australian practice, after Joseph (3), to adopt the lower bound for design purposes. This approach is retained here because it ensures the design has a positive safety factor and recognises that pipelines may sustain minor surface damage during installation, which could promote fatigue crack initiation. Note that for fatigue loading situations, the maximum pressure reached in the repetitive cycle should not exceed the static pressure rating of the pipe.
Recommended fatigue cycle factors for PVC-U, PVC-M and PVC-O are given in Table 1 below:
| Total Cycles | Approx No. Cycles/day for 100y life | Fatigue Cycle Factors, f | ||
| PVC-U | PVC-M | PVC-O | ||
| 26,400 | 1 | 1 | 1 | 1 |
| 100,000 | 3 | 1 | 0.67 | 0.75 |
| 200,000 | 5.5 | 0.81 | 0.54 | 0.66 |
| 500,000 | 14 | 0.62 | 0.41 | 0.56 |
| 1,000,000 | 27 | 0.5 | 0.33 | 0.49 |
| 2,500,000 | 82 | 0.38 | 0.25 | 0.41 |
| 5,000,000 | 137 | 0.38 | 0.25 | 0.41 |
| 10,000,000 | 274 | 0.38 | 0.25 | 0.41 |
Using Table 1, the Maximum Cyclic Pressure Range for a given class of pipe can be calculated from the following formula:
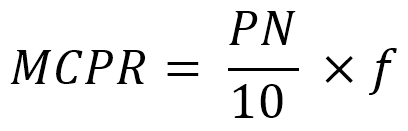
Charts plotting the MCPR versus the number of cycles for a range of pressure classes of PVC-U, PVC-M and PVC-O pipes are available:
Procedure
To select the appropriate pipe class for fatigue loading, the following procedure should be adopted:
- Estimate the likely pressure range, i.e., the maximum pressure minus the minimum pressure.
- Estimate the frequency or the number of cycles per day which are expected to occur.
- Determine the required service life and calculate the total number of cycles which will occur in the pipe lifetime
- Using the appropriate chart draw a vertical line from the x-axis at ΔP and a horizontal line from the y-axis at the total number of cycles in the pipe lifetime
- Find the intersection point between the horizontal and vertical lines.
- Select the pipe class that bounds the region of this intersection point as the minimum required for these fatigue conditions.
Example:
A sewer rising main has a pump pressure, including static lift and friction losses, of 400 kPa. When the pump starts up, the pressure rises rapidly to 800 kPa before decaying exponentially to the static pumping pressure. On pump shut down, the minimum pressure experienced by the system is 100 kPa. On average, the pump will start up 8 times per day. A minimum life of 100 years is required.
The maximum pressure experienced indicates that a minimum class of PN 9 will be required. A fatigue analysis is now needed to determine suitability, or otherwise, of PN 9.
In this system, the pressure range is 700 kPa. The pump will start up approximately 292,000 times in a 100-year lifetime. However, the exponential cycle pattern means that this should be doubled for design purposes. Therefore, the system should be designed to withstand approximately 584,000 cycles in a 100-year lifetime.
Using Table 1 to determine the fatigue load factors for PVC pipes at 5.8 x 10 5 cycles gives the following class selection:
| Material | Fatigue Cycle Factor, f (Table 1) | Maximum Cyclic Pressure Range (MPa) | Minimum Pipe Class Selection |
| PVC-U | 0.6 | PN9 =0.9 x 0.6 =0.54 <ΔP | PN12 |
| PN12 = 1.2 x 0.6 =0.72 ≥ ΔP | |||
| PVC-M | 0.4 | PN16 =1.6 x 0.4 =0.64 < ΔP | PN18 |
| PN18 = 1.8 x 0.4 =0.72 ≥ ΔP | |||
| PVC-O | 0.54 | PN12.5 =1.25 x 0.54 =0.675 < ΔP | PN16 |
| PN16 = 1.6 x 0.54 =0.86 ≥ ΔP |
The graphical procedure is demonstrated below for PVC-U. Using the charts for PVC-U, draw a vertical line from the pressure range on the x axis and a horizontal line from the number of cycles on the y axis. Find the intersection of these two lines and read off the pipe pressure class that bounds this region. In this example, the intersection point lies in the region bounded by the PN12 curve so PN 12 is required for PVC-U pipe for fatigue loading.
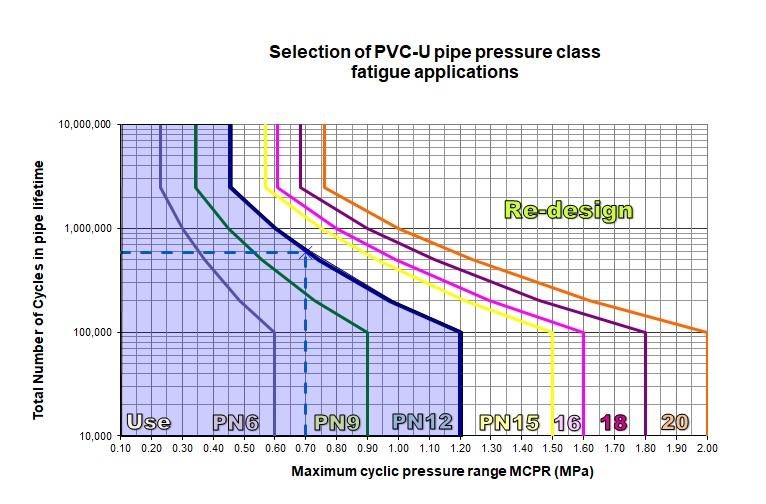
The fatigue analysis thus determines that although PN 9 is adequate for the maximum pressure, a minimum PN 12 pipe is needed for PVC-U, PN18 for PVC-M and PN16 for PVC-O, in order to cope with fatigue effects.
Definition of Pressure Range and effect of surges
For simplicity, the pressure range is defined as the maximum pressure minus the minimum pressure, including all transients, experienced by the system during normal operations. The effect of accidental conditions such as power failure may be excluded. This is illustrated in the figure below.
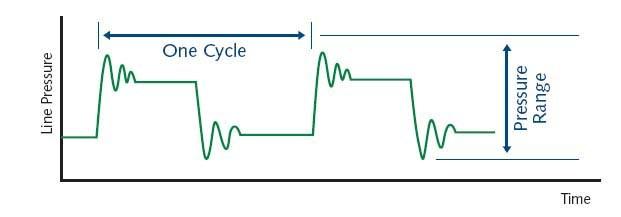
This figure also illustrates the definition of a cycle as a repetitive event. In some cases, the cycle pattern will be complex and it may be necessary to also consider the contribution of secondary cycles.
Pumping systems are frequently subject to surging following the primary pressure transient on switching. Such pressure surging decays exponentially, and in effect the system is subjected to a number of minor pressure cycles of reducing magnitude. In order to take this into account, the effect of each minor cycle is related to the primary cycle in terms of the number of cycles which would produce the same crack growth as one primary cycle.
According to this technique, a typical exponentially decaying surge regime is equivalent to 2 primary cycles. For design purposes, the primary pressure range only is considered, with the frequency doubled.
Complex Cycle Patterns
In general, a similar technique may be applied to any situation where smaller cycles exist in addition to the primary cycle. Empirically, crack growth is related to stress cycle amplitude according to (Δσ)3.2. Thus n secondary cycles of magnitude Δσ1, may be deemed equivalent in effect to one primary cycle, Δσ0
where:
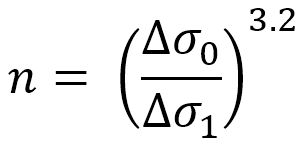
For example, a secondary cycle of half the magnitude of the primary cycle:
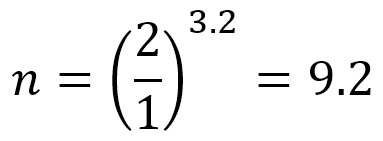
so it would require 9 secondary cycles to produce the same effect as one primary cycle. If they are occurring at the same frequency, the effective frequency of primary cycling is increased by 1.1 for the purpose of design.
Effect of Temperature
Joseph notes that the available data indicates that there is no evidence of a change in response of PVC fatigue crack growth rates with temperature, at least in the lower temperature region where results are available. This is logically consistent with known fatigue behaviour, since the propensity to propagate a crack reduces with increasing ductility which results in yielding and blunting of the crack tip and a reduction in local stress intensity. Thus one would expect that PVC, with increasing ductility and decreasing yield strength, would not be degraded in fatigue performance at higher temperatures.
It follows that, while normal derating principles must be applied in class selection for static pressures, (ductile burst), no additional temperature derating need be applied for dynamic design.
ie. Select the highest class arrived via:
- Static design including temperature derating; or
- Dynamic design as covered herein.
Safety Factors
The tabulated fatigue cycle factors represent the lower bound of test data generated from a number of different sources over the last few years, on commercially produced PVC pipes. The mean line for this data is approximately half a log decade higher than this.
It is therefore considered conservative and no additional safety factor need be applied in general. However, where the magnitude or frequency of dynamic stresses cannot be estimated in design with any reasonable degree of accuracy, appropriate caution should obviously be applied. This judgement is in the hands of the designer.
Whilst it is always possible to predict the steady operating conditions with good accuracy, it will occasionally be the case, in complex systems, that it is impossible to predict the extent of surge pressures. In such circumstances, relatively low-cost surge mitigation techniques, for example the solid state soft-start motor controllers should be considered. It is of course recommended that actual operating conditions for all systems should be checked by measurement, as a matter of routine, when the system is commissioned. Should surge pressure amplitudes in the event exceed expected levels, it is relatively easy matter to retrofit control equipment to ensure that they are kept in check.
Design Hints
To reduce the effect of dynamic fatigue in an installation, the designer can:
- Limit the number of cycles by:
a. Increasing well capacity for a sewer pumping station;
b. Matching pump performance to tank size to eliminate short demand cycles for an automatic pressure unit; or
c. Using double-acting float valves or limiting starts on the pump by using a time clock when filling a reservoir - Reduce the dynamic range by:
a. Eliminating excessive water hammer; or
b. Using a larger bore pipe to reduce friction losses.
Fittings
PVC fittings present a problem worthy of special consideration. Complex stress patterns in fittings can ‘amplify’ the apparent stress cycle. An apparently harmless pressure cycle can thus produce a damaging stress cycle leading to a relatively short fatigue life.
This factor is particularly severe in the case of branch fittings such as tees, where amplification factors up four times have been noted. The condition can be aggravated further by the existence of stress cycling from other sources, for example bending stresses induced flexing under hydraulic thrust in improperly supported systems.
Prudence therefore dictates that a suitable factor of safety be applied to fittings in assessing class requirements. It is recommended that the following factors be applied to the design dynamic pressure cycle for fittings:
| Tees | equal | D x ¾D | D x ½ D | D x ¼ D |
| Safety Factor | 4 | 3 | 2 | 1.5 |
| Bends | 90°short | 45°short | 90°long | 45°long |
| Safety Factor | 3 | 2 | 2 | 1.5 |
| Reducers | D x ¾D | D x ½ D | D x ¼ D |
| Safety Factor | 1.5 | 2 | 2.5 |
| Adaptors & Couplings | equal size | wyes |
| Safety Factor | 1 | 6 |
Example:
A golf course watering scheme is designed to operate at 0.70 MPa. Balanced loading will ensure no pump cycling during routine watering. However, the system is to be maintained on standby with a jockey pump for hand watering purposes and this will cut in and out at 0.35 and 0.75 MPa. With normal usage and leakage this may occur every half hour on average for twelve hours a day. A twenty-five year life is required.
The pressure cycle is 0.4 MPa. Allow 20% for water hammer but no surging is likely in this type of system. Total dynamic cycle 0.48 MPa. The total life cycles predicted is 25 x 365 x 25 = 228,000. Using the table, the MCPR of a PN 9 pipe is 0.64. Therefore, PN 9 pipe is satisfactory (PN 9 is required to cope with normal operational pressure). For fittings the effective dynamic cycle is:
Equal Tees : 4 x 0.48 = 1.92 MPa
Elbows 90° : 3 x 0.48 = 1.44 MPa
PN 18 fittings are suitable for only 1.8 MPa effective dynamic range. Equal tees may not have an acceptable life in this system.
Solution: Reduce the dynamic range or reduce the frequency or the periods on standby.
References
- MARSHALL, G.P., BROGDEN, S. :Final Report of Pipeline Innovation Contract to UKWIR 1997.
- WATER U.K. Ltd, Water Industry Specification, WIS 4-37-02, March 2000, Issue 1.
- JOSEPH, S.H., (University of Sheffield) “Fatigue Failure and Service Lifetime in uPVC Pressure Pipes”, Plastics and Rubber Processing and Applications, Vol 4, No. 4, 1984, pp. 325-330, UK.
- HUCKS, R.T., “Designing PVC pipe for water distribution systems”, J. AWWA, 7 (1972), pp. 443-447.
- KIRSTEIN, C.E., Untersuchung der Innendruck-Schwellfestigkeit von Rohren aus PVC-hart, “Publication of the Institut fur Kunstsoffprufung and Kunststoffkunde”, Unversitat Stuttgart, 1972.
- GOTHAM, K.V. AND HITCH, M.J., “Design considerations for fatigue in uPVC pressure pipelines”, Pipes and Pipelines Int., 20 (1975), pp. 10-17.
- STAPEL, J.U., “Fatigue properties of unplasticised PVC related to actual site conditions in water distribution systems”, Pipes and Pipelines Int., 22 (1977), pp. 11-15 and 33-36.
- GOTHAM, K.V. AND HITCH, M.J., “Factors affecting fatigue resistance in rigid uPVC pipe compositions”, Brit. Polym. J., 10 (1978), pp. 47-52.
- JOSEPH, S.H., “The pressure fatigue testing of plastic pipes”, Plastics Pipes 4, PRI, London, 1979, Paper 28.
- MOORE, D.R., GOTHAM, K.V. AND LITTLEWOOD, M.J., “The long term fracture performance of uPVC pipe as influenced by processing”, Plastics Pipes 4, PRI, London, 1979, Paper 27.
- MARSHALL, G. P., BROGDEN, S., AND SHEPHERD, M. A., “Evaluation of the surge and fatigue resistance of PVC and PE pipeline materials for use on the U.K. Water Industry”, Plastics Pipes X Conference, Gothenburg, Sweden, 1998
- FITZPATRICK, P., MOUNT, P., SMYTH, G. AND STEPHENSON, R. C., “Fracture toughness and dynamic fatigue characteristics of PVC/CPE blends”, Plastics Pipes 9 Conference, Edinburgh, Scotland, 1995.
- DUKES, B.W., “The dynamic fatigue behaviour of UPVC pressure pipe.”, Plastics Pipes VI, PRI, York, UK, 1985.
- TRUSS R. W., “Lifetime predictions for uPVC pipes subjected to combined mean and oscillating pressures”, Plastics and Rubber Processing and Applications, Vol 10, No. 1, 1988, pp. 1-9.
- BURN L. S., “Installation damage: Effect on lifetimes of uPVC pipes subjected to cyclic pressure”, Urban Water Research Association of Australia, Melbourne, Research Report 68 (1993).
- WHITTLE A. J. AND TEO A., “Resistance of PVC-U and PVC-M to cyclic fatigue”, Plastics, Rubber and Composites, Vol 34, No. 1, 2005, pp. 40-46.
- WEST D.B., “Fatigue-Life, Fatigue-Limits and Delamination in Oriented Poly(Vinyl Chloride) Pipes”, A thesis submitted for the degree of Doctor of Philosophy at The University of Queensland, January 2008